
Download Data
Crop Allocation to Food, Feed, Nonfood
Worldwide demand for crops is increasing rapidly due to global population growth, increased biofuel production, and changing dietary preferences. Meeting these growing demands will be a substantial challenge that will tax the capability of our food system and prompt calls to dramatically boost global crop production. However, to increase food availability, we may also consider how the world’s crops are allocated to different uses and whether it is possible to feed more people with current levels of crop production. Of particular interest are the uses of crops as animal feed and as biofuel feed stocks. Currently, 36% of the calories produced by the world’s crops are being used for animal feed, and only 12% of those feed calories ultimately contribute to the human diet (as meat and other animal products). Additionally, human-edible calories used for biofuel production increased fourfold between the years 2000 and 2010, from 1% to 4%, representing a net reduction of available food globally. In this study, we re-examine agricultural productivity, going from using the standard definition of yield (in tons per hectare, or similar units) to using the number of people actually fed per hectare of cropland. We find that, given the current mix of crop uses, growing food exclusively for direct human consumption could, in principle, increase available food calories by as much as 70%, which could feed an additional 4 billion people (more than the projected 2–3 billion people arriving through population growth). Even small shifts in our allocation of crops to animal feed and biofuels could significantly increase global food availability, and could be an instrumental tool in meeting the challenges of ensuring global food security.
Citation:
Cassidy, E. S., West, P. C., Gerber, J. S., & Foley, J. A. (2013). Redefining agricultural yields: from tonnes to people nourished per hectare. Environmental Research Letters, 8(3), 34015. http://iopscience.iop.org/article/10.1088/1748-9326/8/3/034015/meta
Contact:
Direct questions by email to earthstat.data@gmail.com
For additional information regarding publications and research, visit http://gli.environment.umn.edu/
Data Products:
- The following data products are included:
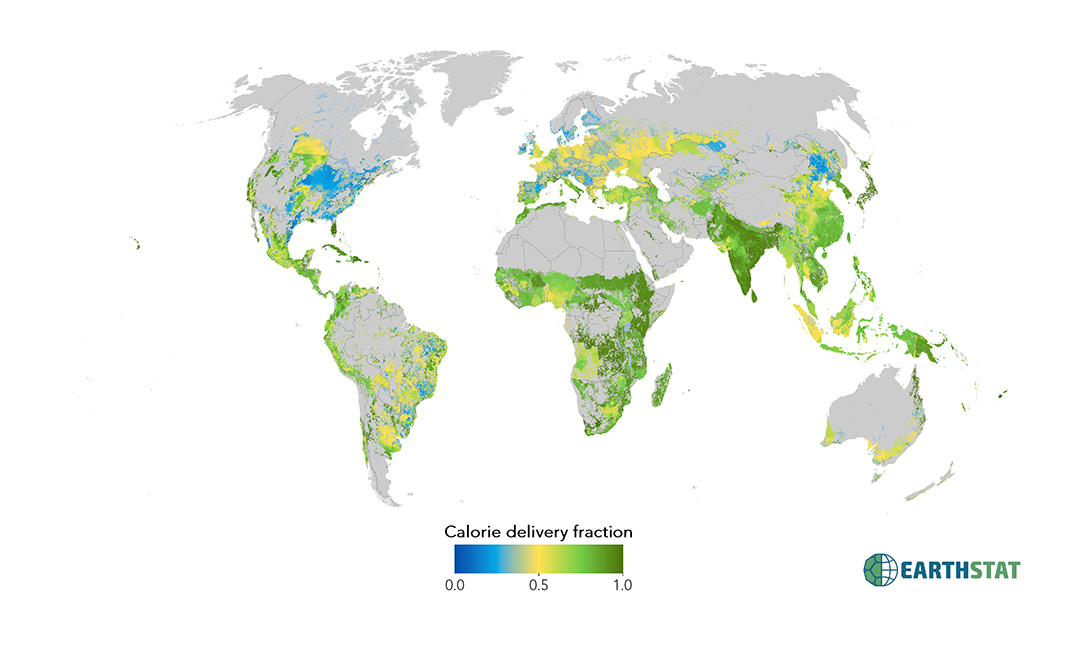
- DeliveredkcalFraction.tif: Fraction of produced calories that are ultimately delivered as food calories after accounting for the type of crop and its allocation as food, feed, or nonfood.
- GlbFoodkcal.tif: Total kilocalories produced for usage as food.
- GlbFeedkcal.tif: Total kilocalories produced for usage as feed.
- GlbNonFoodkcal.tif: Total kilocalories produced for usage as non-food products.
- Glbkcal.tif: Total kilocalories produced for all types of allocations (sum of Food/Feed/NonFood).
FoodProdAreaFrac.tif: Fraction of total harvested area used to produce food directly for feed (the remainder represent area used for feed and nonfood uses).
Resolution:
Spatial: Five minute by five minute resolution (~10km x 10km at equator)
Map Projection:
- Data presented as five-arc-minute, 4320 x 2160 cell grid
- Spatial Reference: GCS_WGS_1984
- Datum: D_WGS_1984
- Cell size: 0.083333 degrees
- Layer extent:
- Top : 90
- Left: -180
- Right: 180
- Bottom: -90
License:
Data may be freely downloaded for research, study, or teaching, but must be cited appropriately. Re-release of the data, or incorporation of the data into a commercial product, is allowed only with explicit permission. If you would like to request permission to use EarthStat data for another purpose, please contact us at earthstat.data@gmail.com.
Methods:
We map the global extent and productivity of 41 major agricultural crops (which account for >90% of total calorie production around the world) by using the EarthStat crop production data of Monfreda et al. These data use a global compilation of census data and satellite images to depict geographic patterns of crop area and yields across the world on a 5′ × 5′ latitude–longitude grid (equivalent to roughly 9 km × 9 km on the equator). These Monfreda et al data represent ‘circa 2000’. Most values are averaged from 1997 to 2003, except where data are missing.
Crop allocations
National-level crop allocations are determined by:
where crop allocationc,n represents the crop uses (subscript c) for a given nation (subscript n), and importing nations’ allocationsc is a crop specific global average use of importing nations.
Crop allocationc,n statistics were derived using the Food and Agriculture Organization’s (FAO) Food Balance Sheets and trade statistics, which report crop productionc,n,exportsc,n, and domestic allocationsc,n at the national level. We used these data for the years 1997–2003 (the same years as Monfreda et al. To examine how crops were allocated—whether for human consumed food, animal feed, biofuels, or other non-food uses, relative proportions of crop production going to ‘food’, ‘feed’, ‘processed’ and ‘other’ were used for each crop in each nation. These crop allocationc,n proportions were then multiplied by the crop production data of Monfreda et al.
Beyond the more straightforward calculations, we had to make a number of key assumptions. We assume that processed oil crop production separates the oils for human consumption or industrial uses, and the protein-dense cake or meal is directed to animal feed. Crops allocated to biofuels were determined for major biofuel producing nations in the year 2000: United States, Brazil, Germany and France. In the year 2000, the United States and Brazil used maize and sugar cane as their respective biofuel feedstocks, whereas France and Germany used rapeseed for biodiesel production. Data on the magnitude of crop production used for biofuel production in 2000 were taken from the World Watch Institute. For maize being directed to ethanol production in the United States, we assume 34% of the calories are redirected into ‘Feed’ as dried distillers’ grains. Likewise we assumed rapeseed meal, as a byproduct of biodiesel production in Europe, was directed to animal feed.
It is important to note that crop production within a given nation is not necessarily consumed domestically. In order to determine how exported crop production was allocated, we used FAO trade statistics to determine how importing nations allocate crops (importing nations’ allocationsc). We then assumed exports were allocated based on these crop specific global average allocations for importing nations. Importing nations crop allocations were weighted by how much each nation was importing, and how they allocated each crop. In this way, we map food delivery per hectare of cropland, regardless of where the food is consumed.
2.2. Livestock feed conversions and calorie delivery
Crop use statistics were used to determine the number of calories delivered to the food system, which include food calories (which were used for direct human consumption), and feed calories after they were converted to meat, egg, and dairy calories. Crops that were used for other non-food uses (biofuels and other industrial uses) were not delivered to the food system. Produced crop calories and protein were determined from the crop caloric and protein contents which were derived by Tilman et al.
In our analysis, feed calories are converted to edible meat, egg and dairy calories using conversion efficiencies from the USDA. These livestock conversion efficiencies are an estimate of how many edible calories result from the conversion from feed calories, based on national-level livestock production statistics (reported data on ‘cattle meat’, ‘chicken meat’, ‘pig meat’, ‘hen eggs’, and ‘cow’s milk’ were used).
Many commonly used feed-to-meat conversions, for example 12 kg of feed to 1 kg of beef, or 5 kg of feed to 1 kg of chicken, are in terms of kilograms of feed required per kilogram of live-weight gain. However, not all of the live-weight of an animal is edible to humans. For example, on average only 60% of beef cattle live-weight is edible. To determine the edible feed-to-edible meat calorie conversions, we utilize USDA feed to live-weight conversions, the proportion of animal live-weight that is carcass (also known as the ‘dressed weight’), as well as data on the calorie content of animal carcasses. For example, the beef conversion efficiency used here uses a feed to live-weight conversion of 12.7, and a dressing proportion of 0.6 gives us tonnes of feed per tonne of carcass weight by: tonnes feed per tonne live-weight tonnes of live-weight per tonne of tonnes feed per tonne of carcass weight. This study estimates the inputs and outputs of livestock production on feed grains and does not account for the weight gains beef and dairy cattle obtain during their weaning and grass fed stages.
Our analysis only considers the production of meat and dairy production from animal feed; grazing systems for animal production are not evaluated here. Naturally, animal grazing introduces calories into the food system that did not originate in feed crops; accordingly, beef cattle grazing was accounted for by including only beef that was produced in landless or mixed crop–livestock systems. Additionally, other ruminants (goats, sheep, etc) were not considered in this study, as they typically do not consume feed grains.