
Download Data
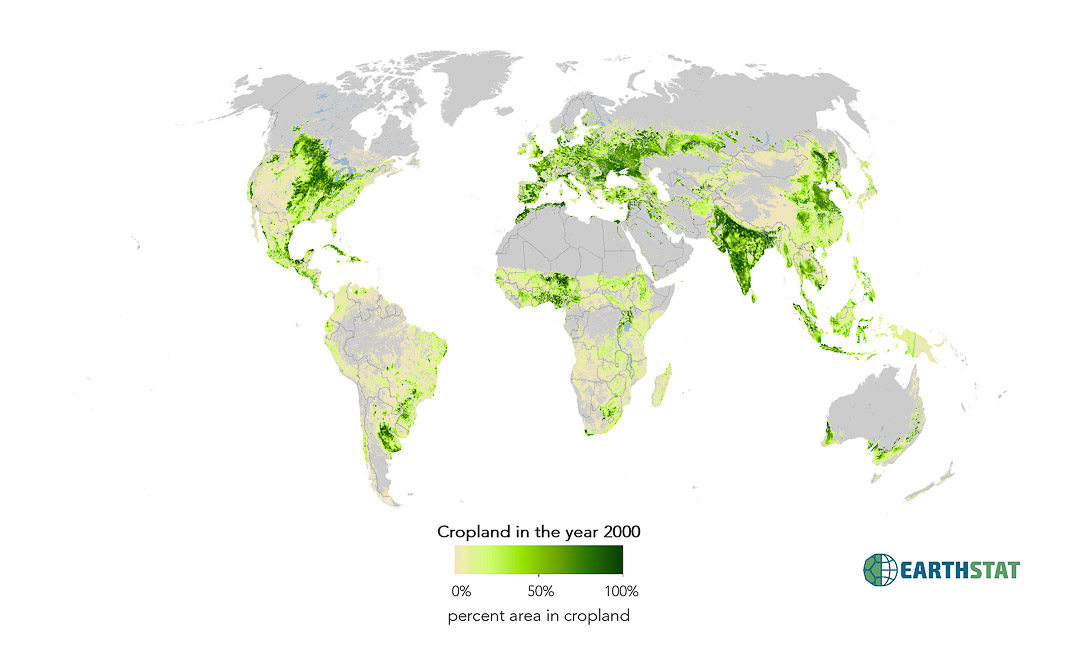
Cropland and Pasture Area in 2000
Agricultural activities have dramatically altered our planet’s land surface. To understand the extent and spatial distribution of these changes, this data set displays croplands and pastures circa 2000 by combining agricultural inventory data and satellite-derived land cover data. The agricultural inventory data, with much greater spatial detail than previously available, is used to train a land cover classification data set obtained by merging two different satellite-derived products (Boston University’s MODIS-derived land cover product and the GLC2000 data set). Our data are presented at 5 min (~10 km) spatial resolution in longitude by longitude, have greater accuracy than previously available, and for the first time include statistical confidence intervals on the estimates. According to the data, there were 15.0 (90% confidence range of 12.2–17.1) million km2 of cropland (12% of the Earth’s ice-free land surface) and 28.0 (90% confidence range of 23.6–30.0) million km2 of pasture (22%) in the year 2000.
Citation:
Ramankutty, N., A.T. Evan, C. Monfreda, and J.A. Foley (2008), Farming the planet: 1. Geographic distribution of global agricultural lands in the year 2000. Global Biogeochemical Cycles 22, GB1003, doi:10.1029/2007GB002952.
Contact:
Direct questions by email to earthstat.data@gmail.com or navin.ramankutty@ubc.ca
For additional information regarding publications and research, visit http://gli.environment.umn.edu/ or http://www.ramankuttylab.com
Data Products:
- Cropland Area fraction: Fraction of five-minute gridcell area
- Pasture Area fraction: Fraction of five-minute gridcell area
Resolution:
Spatial: Five minute by five minute resolution (~10km x 10km at equator)
Map Projection:
- Data presented as five-arc-minute, 4320 x 2160 cell grid
- Spatial Reference: GCS_WGS_1984
- Datum: D_WGS_1984
- Cell size: 0.083333 degrees
- Layer extent:
- Top : 90
- Left: -180
- Right: 180
- Bottom: -90
License:
Creative Commons Attribution 4.0 International
Methods:
We used two different high-resolution (1-km) satellite based, global land cover classification data sets that are available for circa 2000: Boston University’s Moderate resolution Imaging Spectrometer (MODIS) based global land cover product and the Satellite Pour l’Observation de la Terre (SPOT) VEGETATION based Global Land Cover 2000 (GLC2000) data set. The BU-MODIS land cover product used data acquired from 15 October 2000 to 15 October 2001 to derive 17 land cover classes using a supervised classification scheme. The GLC2000 data set utilized data acquired from 1 November 1999 to 31 December 2000 to derive 22 global land cover classes on the basis of regional classifications performed with the expertise of regional institutions. We applied a simple set of climatic parameters to mask obviously non-agriculture areas within the satellite data sets, else we obtain some spurious results in the Northern Hemisphere high latitudes (e.g., land classified as open shrublands are found both in the western United States and boreal Canada; because open shrublands have a small fraction of cultivation in the former we end up with croplands in boreal Canada also). This mask included all regions north of 50_N with Growing Degree Day (GDD; base 5_C) less than 1000_C d. This GDD cutoff approximates that empirically estimated by Ramankutty et al. (using their previous cropland data set that does not include a mask, hence there is no circularity), and is conservative compared to the 2000_C d cutoff for agriculture used by Cramer and Solomon. GDD data were calculated according to Ramankutty et al., and interpolated to 1km resolution. We also masked out protected/minimal use areas in the central part of the Australian continent (Bureau of Rural Sciences, Land Use of Australia,Version 3: 2000/2001, Department of Agriculture, Fisheries and Forestry, Australian Natural Resources Data Library, Canberra, Australia, available at http://www.nlwra.gov.au/Data_Library/index.aspx), which otherwise gets classified entirely as pasture.
See page 4 of Farming the Planet for comprehensive list of Agricultural Census Inventory
More Resources
Global Bioenergy Capacity as Constrained by Observed Biospheric Productivity Rates