
Download Data
Greenhouse Gas Emissions on Croplands
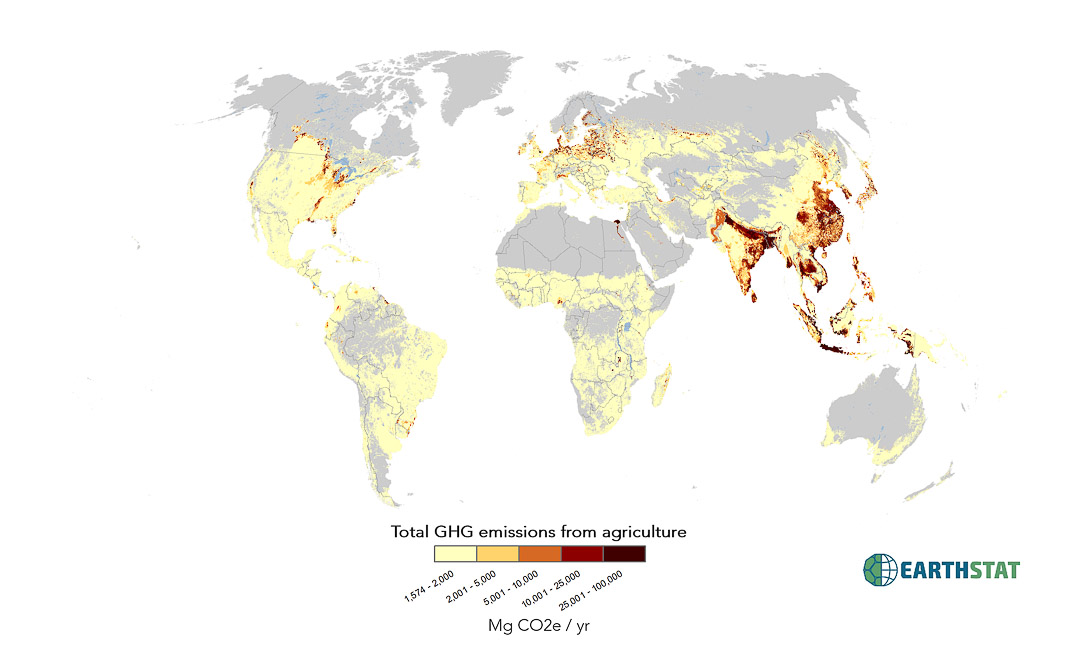
Stabilizing greenhouse gas (GHG) emissions from croplands as agricultural demand grows is a critical component of climate change mitigation. Emissions intensity metrics – including carbon dioxide equivalent emissions per kilocalorie produced (“production intensity”) – can highlight regions, management practices, and crops as potential foci for mitigation. Yet their spatial and crop-wise distribution has been uncertain. Here, we develop global crop-specific circa 2000 estimates of GHG emissions and GHG intensity in high spatial detail, reporting the effects of rice paddy management, peatland draining, and nitrogen (N) fertilizer on CH4, CO2, and N2O emissions. Global mean production intensity is 0.15 Mg CO2e M kcal-1, yet certain cropping practices contribute disproportionately to emissions. Peatland drainage (3.7 Mg CO2e M kcal-1) – concentrated in Europe and Indonesia – accounts for 33% of these cropland emissions despite peatlands producing just 1.1% of total crop kilocalories. Methane emissions from rice (0.54 Mg CO2e M kcal-1), a crucial food staple supplying 15% of total crop kilocalories, contribute 46% of cropland emissions, with outsized production intensity in Vietnam. In contrast, N2O emissions from N fertilizer application (0.034 Mg CO2e M kcal-1) account for only 21% of cropland emissions. We find that current total GHG emissions are largely unrelated to production intensity across crops and countries. Climate mitigation policies should therefore be directed to locations where crops have both high emissions and high intensities.
Citation:
Carlson KM, JS Gerber, ND Mueller, et al. 2016. Greenhouse gas emissions intensity of global croplands. Nature Climate Change. doi: 10.1038/nclimate3158
Contact:
Direct questions by email to earthstat.data@gmail.com or kimberly.carlson@hawaii.edu
For additional information regarding publications and research, visit http://gli.environment.umn.edu/ or http://www.ramankuttylab.com
Data Products:
The following data products are included:
- Total Emissions from Croplands (Mg CO2e yr-1)
(Represented by total_emissions) - Per Kilocalorie Emissions From Croplands (Mg CO2e M kcal-1)
(Represented by kcal_emissions) - Per Food Kilocalorie Emissions From Croplands (Mg CO2e M kcal-1)
(Represented by food_kcal_emissions)
Resolution:
- Spatial: Five minute by five minute resolution (~10km x 10km at equator)
- Temporal: Year 2000 – Average of census data between 1997-2003
Map Projection:
- Data presented as five-arc-minute, 4320 x 2160 cell grid
- Spatial Reference: GCS_WGS_1984
- Datum: D_WGS_1984
- Cell size: 0.083333 degrees
- Layer extent:
- Top : 90
- Left: -180
- Right: 180
- Bottom: -90
License:
Creative Commons Attribution 4.0 International
Data may be freely downloaded for research, study, or teaching, but must be cited appropriately. Re-release of the data, or incorporation of the data into a commercial product, is allowed only with explicit permission. If you would like to request permission to use EarthStat data for another purpose, please contact us at earthstat.data@gmail.com.
Methods:
We calculated greenhouse gas (GHG) emissions from global croplands circa year 2000 for 172 crops. The Monfreda, et al. cropland maps used in our analysis were derived by distributing agricultural census data onto remotely sensed cropland locations at 5 arc-minute resolution and represent 1997-2003 means of yields and harvested areas. We converted all GHGs to carbon dioxide equivalent (CO2e) using IPCC AR5 100 year Global Warming Potential.