
Download Data
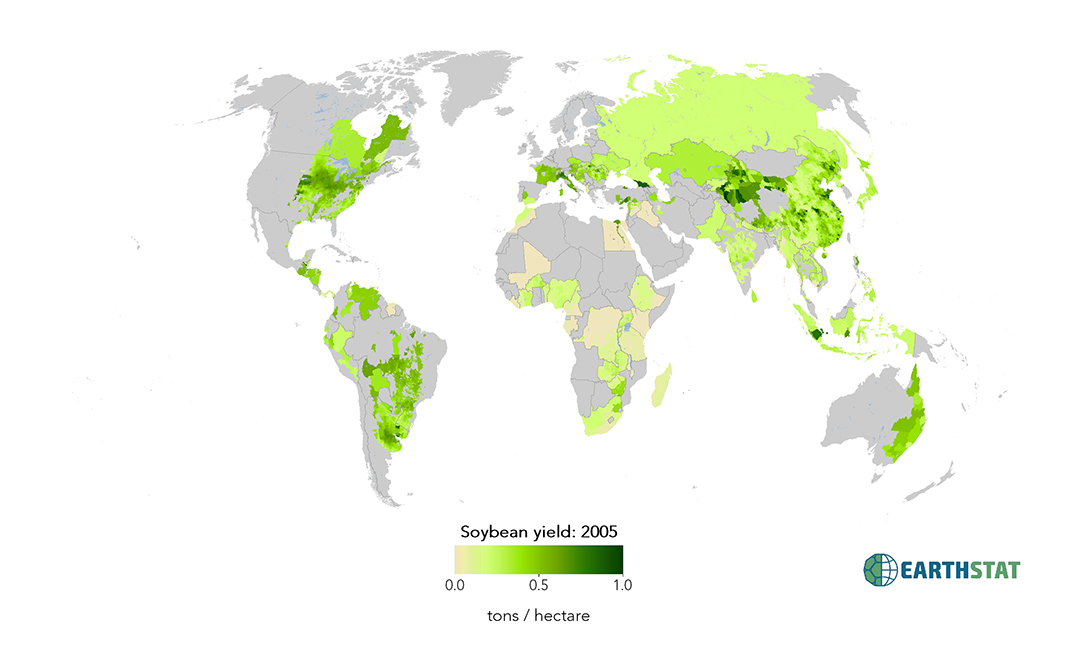
Harvested Area and Yield for 4 Crops (1995-2005)
Croplands cover ~15 million km2 of the planet and provide the bulk of the food and fiber essential to human well-being. Most global land cover data sets from satellites group croplands into just a few categories, thereby excluding information that is critical for answering key questions ranging from biodiversity conservation to food security to biogeochemical cycling. Information about agricultural land use practices like crop selection, yield, and fertilizer use is even more limited. Here we present land use data sets created by combining national, state, and county level census statistics with a global data set of croplands on a 5 minute by 5 minute (~10 km by 10 km) latitude/longitude grid. The resulting land use data sets depict five-year averages for 1995, 2000, and 2005 area (harvested) and yield of wheat, maize, rice, and soybean.
Citation:
Ray, D. K., Ramankutty, N., Mueller, N. D., West, P. C., & Foley, J. a. (2012). Recent patterns of crop yield growth and stagnation. Nature Communications, 3, 1293. https://doi.org/10.1038/ncomms2296
Based on previous research:
Monfreda, C., N. Ramankutty, and J. A. Foley (2008), Farming the planet: 2. Geographic distribution of crop areas, yields, physiological types, and net primary production in the year 2000, Global Biogeochem. Cycles, 22, GB1022, doi:10.1029/2007GB002947.
Contact:
Direct questions by email to earthstat.data@gmail.com
For additional information regarding publications and research, visit http://gli.environment.umn.edu/ or http://www.ramankuttylab.com
Data Products:
The following data products are included for each of 4 crops:
- Harvested Area: fractional
- Crop-specific data representing the average fractional proportion of a grid cell that was harvested in a crop during the 1997-2003 era.
- Yield : tons per hectare
- Crop-specific data representing the average yield for a crop in tons per hectare during the 1997-2003 era
Resolution:
- Spatial: Five minute by five minute resolution (~10km x 10km at equator)
- Temporal: Five year averages for 1995 (1993-1997), 2000 (1998-2002), and 2005 (2003-2007).
Map Projection:
- Data presented as five-arc-minute, 4320 x 2160 cell grid
- Spatial Reference: GCS_WGS_1984
- Datum: D_WGS_1984
- Cell size: 0.083333 degrees
- Layer extent:
- Top : 90
- Left: -180
- Right: 180
- Bottom: -90
License:
Data may be freely downloaded for research, study, or teaching, but must be cited appropriately. Re-release of the data, or incorporation of the data into a commercial product, is allowed only with explicit permission. If you would like to request permission to use EarthStat data for another purpose, please contact us at earthstat.data@gmail.com.
Agricultural Inventory Data:
We collected maize, rice, wheat, and soybean area harvested and production numbers from ~13,500 fixed political units to build our national and subnational information of crop yields (yield is the ratio of production and harvested area) at each of these political units. What we describe here is the data used in this specific study, approximately 600,000 census statistics per crop. Out of the 226 political units (nations) for which the Food and Agriculture Organization (FAO) provides national-level data, we collected data at the next administration level for 51 countries, and also at the third administration level for 17 countries. These 51 countries account for ~79% maize, ~80% rice, ~70% wheat, and ~97% soybean harvested areas globally, between 2004-200860. More importantly, these 51 countries account for ~91% maize, ~83% rice, ~78% wheat and ~99% of soybean total global production during the same years. Where sub-national data are available, the frequency of reporting varies among countries. Our largest gap of missing subnational information is from the former Soviet Republics.
Frequently Asked Questions and Tips:
- Why does the harvested area fraction exceed 1 (100% or more of a cell in a single crop)?
- A grid cell may be more than 1.0 or 100% due to multiple harvests per year. For example, if a crop is produced in 60% of the grid cell’s area, and harvested twice in one year, that cell would have a value of 1.2, or 120%.
- These data sets are not intended to be interpreted at the individual grid cell level. Although they are presented at five-minute resolution, the best way to use these maps is to compare counties, states, regions, countries, or continents.
See included Supplemental Information in download package for more in-depth information on data quality and methods:
| Country | Source (see SI) | Number of political units | Time frame (number of years available from 1989 to 2008) | Number of census reported statistics collected per crop | |
| 1 | Argentina | [49], [50] | 499 municipios + 22 states + 1 national level | 20 municipios + 20 states + 20 national | 19960 municipios + 880 states + 40 national |
| 2 | Australia | [49], [51], [52], [53] | 59 statistical divisions + 9 states + national level | 10 statistical divisions + 20 states + 20 national | 1180 statistical divisions + 360 states + 40 national |
| 3 | Austria | [49], [54] | 9 states + 3 regions + national level | 20 states + 20 regions + 20 national | 360 states + 120 regions + 40 national |
| 4 | Belgium | [49], [54] | 11 states + national level (prior to 2000 we used Belgium-Luxembourg) | 20 states + 20 national | 440 states + 40 national |
| 5 | Bolivia | [49], [55] | 9 regions, + national level | 11 regions + 20 national | 198 regions + 40 national |
| 6 | Brazil | [49], [56], [57] | 5510 municipios + 27 states + national level | 20 municipios + 20 states + 20 national | 220400 municipios + 1080 states + 40 national |
| 7 | Bulgaria | [49], [54] | 28 provinces + national level | 1 provinces + 20 national | 56 provinces + 40 national |
| 8 | Canada | [49], [58] | 13 (provinces & territories) + national | 20 (provinces & territories) + 20 national | 520 (provinces & territories) + 40 national |
| 9 | Chile | [49], [59] | 13 regions + national | 20 regions + 20 national | 520 regions + 40 national |
| 10 | China | [49], [60] | 30 provinces/autonomous regions/municipalities + national | 20 provinces + 20 national | 1200 provinces + 40 national |
| 11 | Colombia | [49], [61] | 33 departments + national level | 14 departments + 20 national | 924 departments + 40 national |
| 12 | Czech Republic | [49], [54], [62] | 8 states + national level | 14 states + 20 national | 224 states + 40 national |
| 13 | Ecuador | [49], [63] | 22 states + national level | 9 states + 20 national | 396 states + 40 national |
| 14 | Finland | [49], [54] | 6 counties + 2 states + national level | 17 counties + 17 states + 20 national | 204 (counties) + 68 (states) + 40 national |
| 15 | France | [49], [54] | 22 counties + 8 states + national level | 20 counties + 20 states + 20 national | 880 (counties) + 320 (states) + 40 national |
| 16 | Germany | [49], [54] | 16 states + national | 20 states + 20 national | 640 states + 40 national |
| 17 | Greece | [49], [54] | 13 counties + 4 states + national | 20 counties + 20 states + 20 national | 520 (counties) + 160 (states) + 40 national |
| 18 | Hungary | [49], [54] | 7 states + national | 14 states + 20 national | 196 states + 40 national |
| 19 | India | [49], [64], [65], [66] | 552 districts + 32 states + national | 20 districts + 20 states + 20 national | 22080 districts + 1280 states + 40 national |
| 20 | Indonesia | [49], [67] | 26 states + national level | 16 states + 20 national | 832 states + 40 national |
| 21 | Iran | [49], [68] | 24 states + national level | 20 states + 20 national | 960 states + 40 national |
| 22 | Ireland | [49], [54] | 2 states + national level | 19 states + 20 national | 76 states + 40 national |
| 23 | Italy | [49], [54] | 20 counties + 12 states + national level | 20 counties + 20 states + 20 national | 800 counties + 480 states + 40 national |
| 24 | Japan | [49], [69] | 9 states + national level | 20 states + 20 national | 360 states + 40 national |
| 25 | South Korea | [49], [70] | 14 states + national level | 20 states + 20 national | 560 states + 40 national |
| 26 | Mexico | [49], [71] | 2402 counties + 32 states + national level | 6 counties + 20 states + 20 national | 28824 counties + 1280 states + 40 national |
| 27 | Mongolia | [49], [72] | 20 states + national level | 13 states + 20 national | 520 states + 40 national |
| 28 | Nepal | [49], [69] | 14 states + national level | 20 states + 20 national | 560 states + 40 national |
| 29 | Netherlands | [49], [54] | 12 counties + 4 states + national level | 20 counties + 20 states + 20 national | 480 counties + 160 states + 40 national |
| 30 | Nigeria | [49], [73] | 31 states + national level | 12 states + 20 national | 744 states + 40 national |
| 31 | Norway | [49], [74] | 18 states + national level | 16 states + 20 national | 576 states + 40 national |
| 32 | Pakistan | [49], [69] | 5 states + national level | 19 states + 20 national | 190 states + 40 national |
| 33 | Paraguay | [49], [75] | 19 states + national level | 19 states + 20 national | 722 states + 40 national |
| 34 | Peru | [49], [76] | 26 states + national level | 20 states + 20 national | 1040 states + 40 national |
| 35 | Philippines | [49], [69] | 11 states + national level | 19 states + 20 national | 418 states + 40 national |
| 36 | Poland | [49], [54] | 16 states + national level | 13 states + 20 national | 416 states + 40 national |
| 37 | Portugal | [49], [54] | 7 states + national level | 20 states + 20 national | 280 states + 40 national |
| 38 | Romania | [49], [54] | 8 states + national level | 14 states + 20 national | 224 states + 40 national |
| 39 | Saudi Arabia | [49], [77] | 14 states + national level | 20 states + 20 national | 560 states + 40 national |
| 40 | Slovakia | [49], [54] | 4 states + national level | 14 states + 20 national | 112 states + 40 national |
| 41 | South Africa | [49], [78] | 11 states + national level | 4 states + 20 national | 88 states + 40 national |
| 42 | Spain | [49], [54] | 16 counties + 6 states + national level | 20 counties + 20 states + 20 national | 640 counties + 240 states + 40 national |
| 43 | Sri Lanka | [49], [79] | 24 counties + 9 states + national level | 20 counties + 20 states + 20 national | 960 counties + 360 states + 40 national |
| 44 | Sweden | [49], [54] | 8 states + national level | 20 states + 20 – national | 320 states + 40 national |
| 45 | Thailand | [49], [80] | 72 counties + 5 states + national | 14 counties + 14 states + 20 – national | 2016 counties + 140 states + 40 national |
| 46 | Turkey | [49], [81] | 73 states + national level | 18 states + 20 national | 2628 states + 40 national |
| 47 | United Kingdom | [49], [54] | 12 counties + 4 states + national level | 20 counties + 20 states + 20 national | 480 counties + 160 states + 40 national |
| 48 | United States | [49], [82] | 3078 counties + 50 states + national level | 20 counties + 20 states + 20 national | 123120 counties + 2000 states + 40 national |
| 49 | Uruguay | [49], [83] | 19 states + national level | 2 states + 20 national | 76 states + 40 national |
| 50 | Venezuela | [49], [84] | 24 states + national level | 1 states + 20 national | 48 states + 40 national |
| 51 | Vietnam | [49], [85] | 61 counties + 8 states + national level | 14 counties + 14 states + 20 national | 1708 counties + 224 states + 40 national |
| Countries with incomplete national data | |||||
| Former Soviet Republics | [49], [86] | 1 national level | 19 – national (1989-1990; 1992-2008) | 38 national | |
| Eritrea, Ethiopia | [49] | 1 national level | 20 national | 40 national | |
| Countries with complete National data for all years (1989-2008) | |||||
| Afghanistan, Albania, Algeria, American Samoa, Andorra, Angola, Anguilla, Antigua and Barbuda, Aruba, Bahamas, Bahrain, Bangladesh, Barbados, Belize, Benin, Bermuda, Bhutan, Botswana, British Virgin Islands, Brunei Darussalam, Burkina Faso, Burundi, Ivory Coast, Cambodia, Cameroon, Cape Verde, Cayman Islands, Central African Republic, Chad, Republic of Congo, Democratic Republic of Congo, Denmark, Cook Islands, Costa Rica, Cuba, Cyprus, Democratic People’s Republic of Korea (North Korea), Djibouti, Dominica, Dominican Republic, Egypt, El Salvador, Equatorial Guinea, Faeroe Islands, Falkland Islands, Fiji Islands, French Guiana, French Polynesia, Gabon, Gambia, Ghana, Gibraltar, Greenland, Grenada, Guadeloupe, Guam, Guatemala, Guinea, Guinea-Bissau, Guyana, Haiti, Honduras, Iceland, Iraq, Isle of Man, Israel including Palestine, Jamaica, Jordan, Kenya, Kiribati, Kuwait, Lao People’s Democratic Republic, Lebanon, Lesotho, Liberia, Libyan Arab Jamahiriya, Liechtenstein, Luxembourg, Madagascar, Malawi, Malaysia, Maldives, Mali, Malta, Marshall Islands, Martinique, Mauritania, Mauritius, Mayotte, Micronesia (Federated States of), Monaco, Montserrat, Morocco, Mozambique, Myanmar, Namibia, Nauru, Netherlands Antilles, New Caledonia, New Zealand, Nicaragua, Niger, Niue, Norfolk Island, Northern Mariana Is, Oman, Palau, Panama, Papua New Guinea, Paracel Islands, Pitcairn Islands, Puerto Rico, Qatar, Reunion, Rwanda, Saint Helena, Saint Kitts and Nevis, Saint Lucia, Saint Pierre & Miquelon, Saint Vincent/Grenadines, Samoa, San Marino, Sao Tome and Principe, Senegal, Seychelles, Sierra Leone, Singapore, Solomon Islands, Somalia, Spratly Islands, Sudan, Suriname, Swaziland, Switzerland, Syrian Arab Republic, Tanzania, Togo, Tokelau, Tonga, Trinidad and Tobago, Tunisia, Turks and Caicos Is, Tuvalu, Uganda, United Arab Emirates, US Virgin Islands, Vanuatu, Wake Island, Wallis and Futuna Is, Western Sahara, Yemen, Zambia, Zimbabwe. | |||||
| Countries not analysed | |||||
| Bosnia and Herzegovina, Croatia, Serbia and Montenegro, Slovenia, Taiwan | |||||