
Download Data
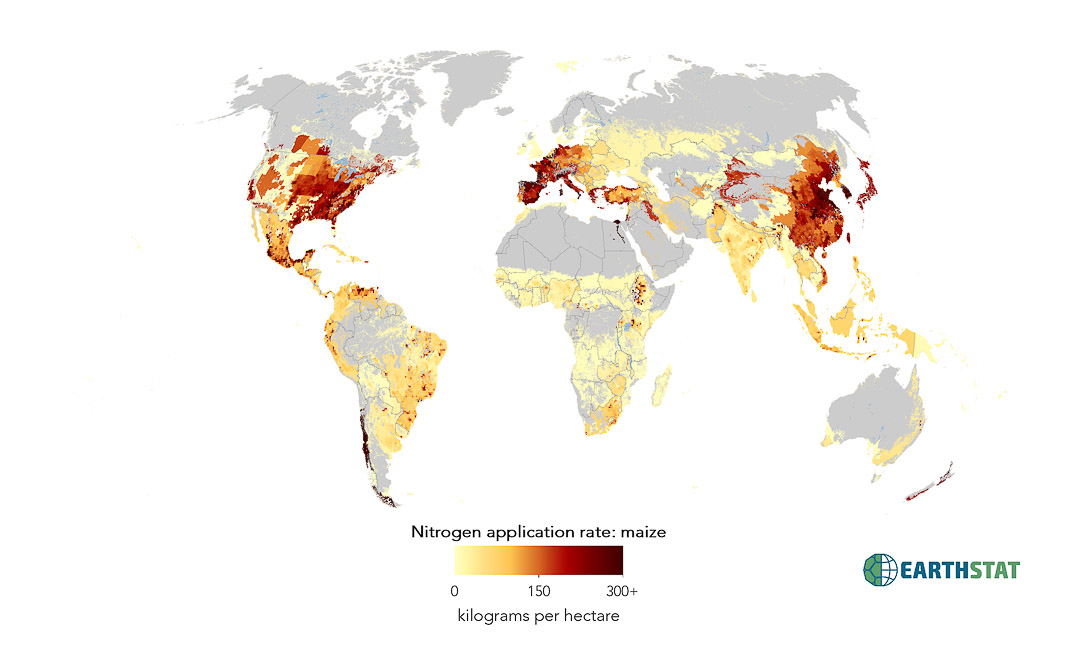
Nutrient Application for Major Crops
Fertilizer application rate and consumption data were compiled for nations and subnational units across the globe. Application rates for crop–country combinations missing data were estimated as described in the methods portion of this document. Crop- and crop-group-specific application rates were then distributed across detailed maps of crop and pasture areas, and rates were harmonized with subnational and national nutrient consumption data. These data include mineral fertilizers, manure, and atmospheric deposition. If you are interested in just one of these individual parts, please contact us.
Citation:
Mineral Fertilizer:
Mueller, ND, JS Gerber, M Johnston, DK Ray, N Ramankutty, and JA Foley. 2012. Closing yield gaps through nutrient and water management. Nature doi: 10.1038/nature11420. 490:254-257.
Manure and Atmospheric Deposition:
West, PC, JS Gerber, ND Mueller, KA Brauman, KM Carlson, ES Cassidy, PM Engstrom, M Johnston, GK MacDonald, DK Ray, and S Siebert. 2014. Leverage points for improving food security and the environment. Science. 345:325-328. doi: 10.1126/science.1246067.
Contact:
Direct questions by email to earthstat.data@gmail.com or nmueller@uci.edu
For additional information regarding publications and research, visit http://gli.environment.umn.edu/
Data Products:
The following data products are included for seventeen ‘major crops’, globally for elemental nitrogen, phosphorus, and potassium mineral and manure fertilizers:
- Nitrogen fertilizer, manure, and atmospheric deposition application rate in kilograms N per hectare
- Total nitrogen fertilizer, manure, and atmospheric deposition applied on landscape in kilograms
- Phosphorus fertilizer and manure application rate in kilograms P2O5 per hectare
- Total phosphorus fertilizer and manure applied on landscape in kilograms P2O5 per hectare
- Potassium fertilizer and manure application rate in kilograms K2O per hectare
- Total potassium fertilizer and manure applied on landscape in kilograms K2O per hectare
- Data quality layers for nitrogen, phosphorus, and potassium
- 1 – subnational rates
- 2 – national-level rate scaled by subnational data
- 3 – national-level rates
- 4 – inferred application rate from countries of similar economic status, scaled by subnational data, matched to FAO
- 4.5 – inferred global application rate, scaled by subnational data, matched to FAO
- 5 – inferred application rate from countries of similar economic status; scaled to match FAO
- 5.5 – inferred application rate from global average; scaled to match FAO
- 6 – inferred application rate from countries of similar economic status; not scaled to match FAO
- 6.5 – inferred application rate from global average; not scaled to match FAO
- any previous number + .25 = any one of the previous data types but scaling of application rates was maxed out at a doubling when trying to match the FAO consumption
List of crops included
‘wheat’, ‘maize’, ‘rice’, ‘barley’, ‘millet’, ‘sorghum’, ‘soybean’, ‘sunflower’, ‘potato’, ‘cassava’, ‘sugarcane’, ‘sugarbeet’, ‘oilpalm’, ‘rapeseed’, ‘groundnut’, ‘cotton’, ‘rye’
Resolution:
- Spatial: Five minute by five minute resolution (~10km x 10km at equator)
- Temporal: Data represents the year 2000 largely as a collection of data from 1999, 2000. Data for some countries is as old as 1994 or as recent as 2001. See table below.
Map Projection:
- Data presented as five-arc-minute, 4320 x 2160 cell grid
- Spatial Reference: GCS_WGS_1984
- Datum: D_WGS_1984
- Cell size: 0.083333 degrees
- Layer extent:
- Top : 90
- Left: -180
- Right: 180
- Bottom: -90
License:
Creative Commons Attribution 4.0 International
Data may be freely downloaded for research, study, or teaching, but must be cited appropriately. Re-release of the data, or incorporation of the data into a commercial product, is allowed only with explicit permission. If you would like to request permission to use EarthStat data for another purpose, please contact us at earthstat.data@gmail.com.
Methods:
From Mueller et al. 2012, Supplementary Information:
Data Collection
We collected national and sub-national data on fertilizer application rates for crops and crop groupings. A major source of data was the fifth edition of “Fertilizer Use by Crop” (hereafter referred to as the FUBC5 dataset), a joint publication from the International Fertilizer Industry Association (IFA), the International Fertilizer Development Center (IFDC), the International Potash Institute (IPI), the Phosphate and Potash Institute (PPI), and the Food and Agriculture Organization of the United Nations (FAO). The publication contains national-level application rate data by crop for 42 countries, compiled from the following data sources: FAO questionnaires given to member countries; IFA questionnaires given to industry companies, research institutes, and fertilizer associations; IFDC questionnaires sent to experts attending courses, seminars, and professional meetings; and IPI and PPI communications with experts. Most of the application rate data from the FUBC5 dataset are for the years 1999 or 2000, but data for some countries are as old as 1994 and as recent as 2001.
To expand spatial and sub-national data coverage, we also collected data from national statistical bureaus, FAO reports, and national-level fertilizer industry associations (see later sections for more description on how these datasets were compiled and harmonized). Following Monfreda et al., we established a 7-year data collection window centered on the year 2000 (1997-2003). We calculated averages for countries when data for multiple years was available within this window. When countries did not have data available within our desired timeframe (as was the case for some countries in the FUBC5 dataset), we used data from the year closest to our data collection window. For some countries, the only fertilizer information available was FAO nutrient consumption data, which we collected for all countries available. Data sources are listed below. Sub-national data was all provided at the state/province-level, except for the US AAPFCO data, which we aggregated from the county-level to the state-level for consistency. The countries for which we compiled sub-national data represent 45%, 50%, and 55% of total global N, P2O5, and K2O consumption, respectively (FAO nutrient consumption from 1997-2003).
We next identified “data gaps” for each crop category: countries where we had crop areas but no fertilizer application rate data in our database. As fertilizer use is highly correlated to income-level, we chose to use an income-based extrapolation technique to fill these data gaps. Countries were grouped into four economic aggregates based on the World Bank income classifications: low income, lower middle income, upper middle income, and high income (both OECD and non-OECD countries). For each crop, we calculated area-weighted average fertilizer application rates for each economic aggregate. We then identified the economic group of each country missing application rate data and filled gaps using the average application rates. The poorer data quality of extrapolated rates was noted accordingly in a data quality map corresponding to each crop.
For some crops, we lacked observational data on application rates from any country within a particular economic group. In these cases we calculated the area-weighted average application rate across the entire globe and utilized this rate to extrapolate to areas missing data. While clearly not ideal, having an application rate value for each crop, even if it is of low quality, allows us to scale the application rates to match total FAO nutrient consumption in a country. This allows us to gain a first-order approximation of the true application rate.
We collected fertilizer data (from either a crop-specific or crop-group-specific application rate) for 138 crops and pasture. No tabular fertilizer information in any country was available for some minor crops for which we did have harvested area data (the M3 crop area dataset contains data for 175 crops). We disregarded these crops in our dataset and assumed negligible fertilizer consumption.
Mapping of application rate information
As with previous studies, our approach matches spatial data on agricultural land use with tabular application rate data for particular crops or crop groups. Potter et al. linked cropland or crop-group maps from the M3 croplands dataset and the M3 pasture dataset to each national-level application rate data entry in the FUBC5 dataset. We used and revised the Potter et al. linkages, especially focusing on which Monfreda et al. datasets were used for crop groupings. For example, in Morocco, Potter et al. distributed FUBC5 application rate data for the category “oil crops, other” onto the Monfreda et al. crop map for “oilseeds, other”. Since the only oil crop with its own application rate data listed in the IFA/FAO/IFDC report is sunflower, we chose instead to distribute the fertilizer application rates for the “oil crops, other” category onto all the Monfreda et al. oil crop maps except sunflower (this includes not only the “oilseeds, other” category, but also soybeans, sesame seed, safflower seed, etc.). The same method was applied to identify constituent crops for all crop groups. In most cases, national and sub-national fertilizer application rates from our data were first directly applied to the appropriate crop maps. We modified the raw application rates at this step in three cases: 1) if a data source indicated that only a percentage of a particular cropland area was fertilized, 2) if the fertilized pasture area in a country was less than the pasture area for that country from the M3 pasture dataset, and 3) if we had data for seasonal varieties of barley and wheat. Below are the adjustments made for these three special cases:
- Consistent with the Potter et al. methodology, when only a percentage of a cropland area was fertilized we adjusted application rates downward by the same percentage. For example, the FUBC5 dataset indicates that 85% of Mexico’s avocadoes are fertilized at an average rate of 120 kg N/ha, so we applied an application rate of 102 kg N/ha to all of Mexico’s avocado area.
- Similar to case 1), in many cases only a percentage of pastureland in a country was fertilized. While this percentage was not explicit in the FUBC5 dataset, we calculated this number by comparing the FUBC5 fertilized pasture area with the total M3 pasture areas within each country. For areas where the M3 pasture areas were greater than FUBC5 pasture areas, we reduced application rates by the proportion of FUBC5 pasture area to M3 pasture area (i.e. if FUBC5 listed half the pasture area contained in the M3 dataset, we reduced the FUBC5 pasture application rates by half).
- For seasonal varieties of wheat and barley, we calculated average “wheat” and “barley” application rates, weighting the FUBC5 seasonal crop application rates by the FUBC5 seasonal areas.
Harmonize with FAO consumption dataset
To harmonize our dataset with 1997-2003 FAO national nutrient consumption data, we first calculated initial estimates for global consumption of N, P2O5, and K2O by multiplying our crop application rate maps by M3 crop areas. We differentiated between “trusted crops” – crops for which we have sub-national or national-level application rate information – and “untrusted crops” – crops for which application rates were derived through the aforementioned extrapolation procedure. In most cases we trusted the application rates from our trusted crops, and thus we only scaled untrusted crop application rates up or down to match average FAO total national nutrient consumption (note that the same scalar was applied to all untrusted crops). Two special cases led us to have less trust in our “trusted crop” consumption and we altered our scaling procedure:
- When the scaling correction for untrusted crops required more than a doubling of those application rates within a country, we chose to scale the application rates of all crops to meet FAO consumption levels. In a few small countries, we also capped the scalar for all crops at a doubling of application rates. In these cases our data were not reconciling either due to underreporting of cropland area, crops missing from our dataset, or errors with either the application rate data or the FAO consumption data.
- When the total fertilizer consumption summed over trusted crops alone already exceeded or nearly exceeded (>95%) the FAO consumption within a country, we adjusted the scaling procedure by scaling the application rates of all crops to match the FAO consumption. Again, this is another case where our multiple datasets were not reconciling due to one of the above possible complications.
No FAO consumption data was available for Gibraltar, Liechtenstein, Western Sahara, and 37 small island countries and territories. For these locations, consumption was recorded as “not a number”. Application rate data remained un-scaled and was noted accordingly in the data quality map.
Enhance sub-national resolution
Sub-national consumption and aggregate application rate data, when available, was used to add spatial resolution to our national application rate data. Consumption data came in three main forms: 1) total nutrient consumption in each sub-national unit, 2) fertilizer consumption by type (i.e. “nitrogenous” or “compound”) in each sub-national unit, and 3) average nutrient application rates (across all crops) in each sub-national unit. We multiplied average application rates by the number of potentially fertilized hectares (as defined by the sum of the crop proxy and pasture maps) to obtain nutrient consumption in each sub-national unit. Then, for all countries except the US, we harmonized the sum of the sub-national consumption data for each nutrient (including compound fertilizers when available) by scaling it to match the FAO national consumption data. In the US, sub-national consumption data was already listed in units of N, P2O5, and K2O, but it could not be compared to FAO consumption because the data did not have national coverage. Due to this complication, we used the US sub-national consumption data directly without calibration to FAO.
Next, we added up consumption according to our application rate and area maps in each sub-national unit. Application rates for all crops, except those for which we had sub-national application rate data, were scaled so that the sum of all consumption in the sub-national unit matched the sub-national consumption data. Scalars were allowed to vary ±25%, since we observed that variation from the median rate commonly varied ±25% in countries where we had sub-national data. Sub-national application rates were not scaled using the sub-national consumption data. The sub-national scaling cap of ±25% can slightly affect consistency with the FAO consumption dataset. Thus, for countries where we calculated and used sub-national consumption scalars, we once again scale all application rates – except those originally from sub-national data sources – to match FAO consumption data.
Record data quality
The quality of application rate data varies substantially across the globe due to the availability of input data. For example, an application rate may come directly from unaltered sub-national data, it could be a national-level application rate scaled by sub-national consumption data, an extrapolated rate from similar-income countries normalized to FAO consumption, etc. Thus, we recorded data quality in a data type map for each nutrient and crop combination that details the quality of the input data and the manipulations made (if any) to record or estimate fertilizer application rate at every location where that crop is cultivated. Data type is indicated in each map through a unique numerical code.
| data source | spatial coverage | data type | years |
| FAO4 | 194 countries | national-level consumption | 1997-2003 |
| IFA/IFDC/IPI/PPI/FAO2 | 88 countries and Taiwan | national-level application rates by crop | 1994-2001 |
| Australian Bureau of Statistics24, 25 | Australia | sub-national consumption | 2000-2002 |
| FAO26 | Brazil | sub-national application rates by crop; average sub-national application rates | 2002 |
| FAO27 | Bulgaria | national-level application rates by crop | 1998 |
| Statistics Canada28 | Canada | sub-national consumption | 2000 |
| National Bureau of Statistics of China29 | China | sub-national consumption | 1997-2002 |
| FAO30 | Cuba | national-level application rates by crop | 1997-2002 |
| UNIFA31 | France | average sub-national application rates | 1997-2003 |
| Statistisches Bundesamt, BMELV32 | Germany | sub-national consumption | 2005-2006 |
| FAO33 | India | sub-national application rates by crop | 2003-2004 |
| India Department of Agriculture and Cooperation, Agricultural Census Division34 | India | sub-national consumption | 2001-2002 |
| FAO35 | Iran | sub-national consumption | 2005 |
| ISTAT36 | Italy | sub-national consumption | 2002 |
| FAO37 | Korea, DPR | national-level application rates by crop | 1998-2000 |
| Statistics New Zealand38 | New Zealand | sub-national consumption | 2007 |
| National Fertilizer Development Centre39 | Pakistan | sub-national consumption | 1997-2003 |
| FAO40 | Poland | sub-national application rates by crop; average sub-national application rates | 2003 |
| Ministerio de Agricultura, Pesca y Alimantacion41 | Spain | sub-national consumption | 2005 |
| Turkish Statistical Institute42 | Turkey | sub-national consumption | 1999-2001 |
| AAPFCO5 | USA | sub-national consumption for select states | 2001-2002 |
| USDA ERS43 | USA | sub-national application rates by crop for select states | 1997-2003 |
Fertilizer data sources, data type, and spatial and temporal coverage.