
Download Data
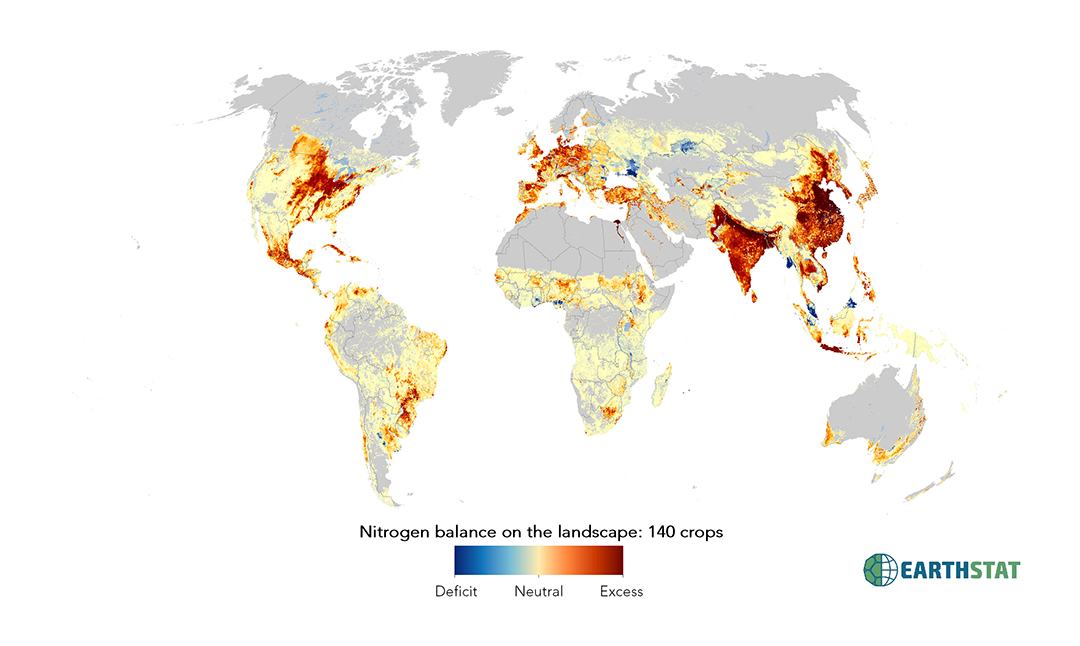
Total Nutrient Balance for 140 Crops
Chemical fertilizers, manure and leguminous crops have been key to agricultural intensification. However, they have also led to widespread nutrient pollution and the degradation of lakes, rivers and coastal oceans. Excess nutrients also incur energy costs associated with converting atmospheric nitrogen and mining phosphorus.
Excess nutrients are not evenly distributed across regions or crops. We find that ~50% of the excess nitrogen and phosphorus is concentrated in only 24% and 21% of the world’s cropland area, respectively. China, India, and the United States together account for ~64 to 66% of excess nitrogen and phosphorus. Furthermore, rice, wheat, and maize alone are responsible for ~58 to 60% of the excess nitrogen and phosphorous of the 17 crops we analyzed globally. Using a yield-response model, we estimate that nitrogen and phosphorus applied to wheat, rice, and maize could be reduced by 14 to 29% and 13 to 22%, respectively, while maintaining current yields. Targeting reductions in fertilizer use to a small set of crops and countries could therefore have a large effect on global nitrogen and phosphorus pollution. Further efficiency gains are possible by altering the timing, placement, and type of fertilizer.
Citation:
West, P. C., Gerber, J. S., Engstrom, P. M., Mueller, N. D., Brauman, K. A., ES Cassidy, PM Engstrom, M Johnston, GK MacDonald, DK Ray, Siebert, S. (2014). Leverage points for improving global food security and the environment. Science, 345(6194), 325-328. http://science.sciencemag.org/content/345/6194/325.abstract
Contact:
Direct questions by email to earthstat.data@gmail.com
For additional information regarding publications and research, visit http://gli.environment.umn.edu/
Data Products:
The following data products are included for 140 crops, listed below, globally for elemental nitrogen and phosphorus:
- Nitrogen balance on landscape in kilograms
- Phosphorus balance on landscape in kilograms
List of crops included:
‘alfalfa’, ‘almond’, ‘apple’, ‘apricot’, ‘artichoke’, ‘asparagus’, ‘avocado’, ‘bambara’, ‘banana’, ‘barley’, ‘bean’, ‘greenbean’, ‘beetfor’, ‘berrynes’, ‘blueberry’, ‘broadbean’, ‘buckwheat’, ‘cabbagefor’, ‘cabbage’, ‘canaryseed’, ‘carob’, ‘carrot’, ‘cashewapple’, ‘cassava’, ‘castor’, ‘cauliflower’, ‘cerealnes’, ‘cherry’, ‘chestnut’, ‘chickpea’, ‘citrusnes’, ‘clover’, ‘cocoa’, ‘coconut’, ‘coffee’, ‘cowpea’, ‘cranberry’, ‘cucumberetc’, ‘currant’, ‘date’, ‘eggplant’, ‘fig’, ‘flax’, ‘fornes’, ‘fruitnes’, ‘tropicalnes’, ‘garlic’, ‘gooseberry’, ‘grapefruitetc’, ‘grape’, ‘grassnes’, ‘groundnut’, ‘hazelnut’, ‘hemp’, ‘hempseed’, ‘hop’, ‘jute’, ‘kiwi’, ‘legumenes’, ‘greenbroadbean’, ‘lemonlime’, ‘lentil’, ‘lettuce’, ‘linseed’, ‘lupin’, ‘maize’, ‘greencorn’, ‘maizefor’, ‘mango’, ‘millet’, ‘mixedgrain’, ‘mixedgrass’, ‘mushroom’, ‘mustard’, ‘rubber’, ‘nutnes’, ‘oats’, ‘oilpalm’, ‘oilseedfor’, ‘oilseednes’, ‘okra’, ‘olive’, ‘greenonion’, ‘onion’, ‘orange’, ‘jutelikefiber’, ‘melonetc’, ‘papaya’, ‘peachetc’, ‘pear’, ‘pea’, ‘greenpea’, ‘pepper’, ‘persimmon’, ‘pigeonpea’, ‘pineapple’, ‘pistachio’, ‘plantain’, ‘plum’, ‘poppy’, ‘potato’, ‘pulsenes’, ‘pumpkinetc’, ‘quince’, ‘rapeseed’, ‘rasberry’, ‘rice’, ‘rootnes’, ‘rye’, ‘ryefor’, ‘safflower’, ‘cotton’, ‘sesame’, ‘sisal’, ‘sorghum’, ‘sorghumfor’, ‘sourcherry’, ‘soybean’, ‘spinach’, ‘stonefruitnes’, ‘strawberry’, ‘stringbean’, ‘sugarbeet’, ‘sugarcane’, ‘sunflower’, ‘sweetpotato’, ‘tangetc’, ‘taro’, ‘tea’, ‘tobacco’, ‘tomato’, ‘triticale’, ‘turnipfor’, ‘vegetablenes’, ‘vegfor’, ‘walnut’, ‘watermelon’, ‘wheat’, ‘yam’
Resolution:
- Spatial: Five-arc-minute by five-arc-minute resolution latitude by longitude (~10km x 10km at equator)
- Temporal: Data represents the year 2000 largely as a collection of data from 1999, 2000. Data for some countries is as old as 1994 or as recent as 2001. See table below.
Map Projection:
- Data presented as five-arc-minute, 4320 x 2160 cell grid
- Spatial Reference: GCS_WGS_1984
- Datum: D_WGS_1984
- Cell size: 0.083333 degrees
- Layer extent:
- Top : 90
- Left: -180
- Right: 180
- Bottom: -90
License:
Data may be freely downloaded for research, study, or teaching, but must be cited appropriately. Re-release of the data, or incorporation of the data into a commercial product, is allowed only with explicit permission. If you would like to request permission to use EarthStat data for another purpose, please contact us at earthstat.data@gmail.com.
Methods:
Excess nutrients are calculated as a simple mass balance, which is similar to recent efforts to estimate nutrient balances (Liu et al., MacDonald et al.). Chemical fertilizer and manure data sets are inputs for both nitrogen and phosphorous models. The nitrogen has additional inputs from nitrogen deposition (Dentener et al.) and nitrogen fixation by legumes. Nitrogen fixation is scaled as a function of yields using a range of Nfix values from the literature (Smil 1999) and yields (Monfreda et al. 2008). Nutrient removal from harvest is estimated as the product of yield (Monfreda et al. 2008), dry fraction (Monfreda et al. 2008), and nutrient density (USDA).