
Download Data
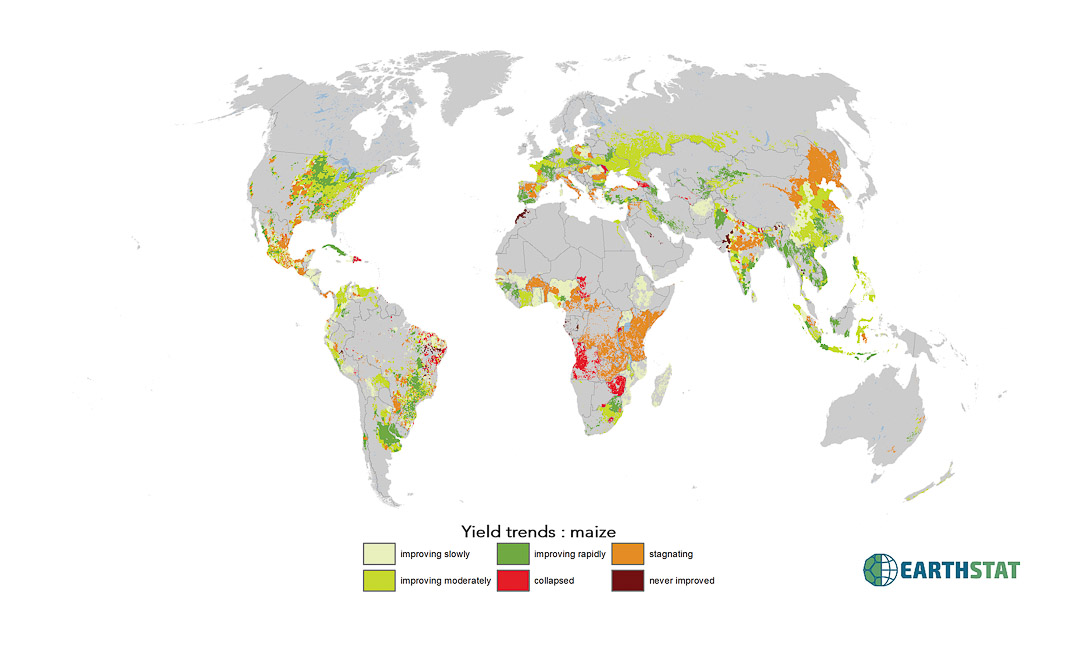
Yield Trends and Changes for Maize, Soybean, Rice, and Wheat
In the coming decades, continued population growth, rising meat and dairy consumption and expanding biofuel use will dramatically increase the pressure on global agriculture. Even as we face these future burdens, there have been scattered reports of yield stagnation in the world’s major cereal crops, including maize, rice and wheat. Here we study data from ~2.5 million census observations across the globe extending over the period 1961–2008. We examined the trends in crop yields for four key global crops: maize, rice, wheat and soybeans. Although yields continue to increase in many areas, we find that across 24–39% of maize-, rice-, wheat- and soybean-growing areas, yields either never improve, stagnate or collapse. This result underscores the challenge of meeting increasing global agricultural demands. New investments in underperforming regions, as well as strategies to continue increasing yields in the high-performing areas, are required.
Several studies have shown that global crop production needs to double by 2050 to meet the projected demands from rising population, diet shifts, and increasing biofuels consumption. Boosting crop yields to meet these rising demands, rather than clearing more land for agriculture has been highlighted as a preferred solution to meet this goal. However, we first need to understand how crop yields are changing globally, and whether we are on track to double production by 2050. Using ∼2.5 million agricultural statistics, collected for ∼13,500 political units across the world, we track four key global crops—maize, rice, wheat, and soybean—that currently produce nearly two-thirds of global agricultural calories. We find that yields in these top four crops are increasing at 1.6%, 1.0%, 0.9%, and 1.3% per year, non-compounding rates, respectively, which is less than the 2.4% per year rate required to double global production by 2050. At these rates global production in these crops would increase by ∼67%, ∼42%, ∼38%, and ∼55%, respectively, which is far below what is needed to meet projected demands in 2050. We present detailed maps to identify where rates must be increased to boost crop production and meet rising demands.
Citation:
Ray DK, N Ramankutty, ND Mueller, PC West, JA Foley. 2012. Recent patterns of crop yield growth, stagnation, and collapse. Nature Communications. 3:1293 doi: 10.1038/ncomms2296
Ray DK, ND Mueller, PC West, JA Foley. 2013. Yield trends are insufficient to double global crop production by 2050. Public Library of Science – ONE. doi: 10.1371/journal.pone.006642
Contact:
Direct questions by email to earthstat.data@gmail.com or navin.ramankutty@ubc.ca
For additional information regarding publications and research, visit http://gli.environment.umn.edu/ or http://www.ramankuttylab.com
Disclaimer:
This data does not contain unique data for each grid cell as it is aggregated based on administrative unit reporting.
This data is compiled using information gathered from individual countries’ agricultural census. The data may be accurate to country level, admin1 level or admin2 level.
Data Products:
The following data products are included:
Categorical bins representing different yield trends (2012)
(Represented by data with categorical in the title.)
Key for Yield Trend Categories:
1: yields never improved
2: yields stagnating
3: yields collapsed
4: yields improving rapidly
5: yields improving moderately
6: yields improving slowly
Rate of yield change (percent/year) (2013)
(Represented by data with percentage in the title)
Resolution:
Spatial: Five minute by five minute resolution (~10km x 10km at equator)
Map Projection:
- Data presented as five-arc-minute, 4320 x 2160 cell grid
- Spatial Reference: GCS_WGS_1984
- Datum: D_WGS_1984
- Cell size: 0.083333 degrees
- Layer extent:
- Top : 90
- Left: -180
- Right: 180
- Bottom: -90
License:
Creative Commons Attribution 4.0 International
Data may be freely downloaded for research, study, or teaching, but must be cited appropriately. Re-release of the data, or incorporation of the data into a commercial product, is allowed only with explicit permission. If you would like to request permission to use EarthStat data for another purpose, please contact us at earthstat.data@gmail.com.
Methods:
From Ray et al. 2012
Data development
Our geospatial crop database covers the period between 1961 and 2008 annually, and tracks maize, rice, wheat and soybean performance across ~13,500 political units (using ~2.5 million unique harvested area and production statistics from the census bureau/agricultural statistics reporting bodies over this time period). These data were further quality controlled, standardized and converted into yield information at three variable spatial levels based on data availability: national, state and county/district/municípios/departments, geographic units. Data availability varied among regions. Missing data values were more common in the early years of the data set. Average values from a 5-year window were then used to interpolate missing sub-national data, constrained by values from the political unit that the data were nested within It should be noted that data quality may be poor in some countries and years, where complete or true information is lacking because of political strife, weak institutions, incentives to misreport data, lacking access to proprietary data and so on.
Yield trend analysis
Yield trends were analysed via parsimoniously choosing among regression models of increasing order at each political unit for each crop: an intercept-only model, linear model, quadratic model and a cubic model. We used the Akaike Information Criterion59 to decide which model fitted the observed data the best. Next, we conducted F-tests at each political unit to determine the goodness of the model fit against the null hypothesis of a constant model. Model parameters themselves guided the classification of yield trends into the four basic categories. An intercept-only model indicated that ‘yields never improved’. If the model chosen was linear with positive slope, it indicated that ‘yields were still improving’, whereas a linear model with negative slope showed that ‘yields collapsed’. Similarly, the sign of the quadratic term when the model chosen is quadratic, and the year of the inflection points when the model chosen is cubic, determined the yield trend category for quadratic and cubic fits. Classification of these models is more complex with details included in Supplementary Note 1 and Supplementary Methods. The statistical fits are appropriate over the observed period, and thus have unknown predictive capacity for future years. Also see Supplementary Tables S2 and S3 for comparisons with other national scale studies and utility of conducting sub-national studies.
Outliers in the data may have influenced model choice in some cases, but it was not possible to remove these data from the analysis, given that it was generally unclear which outliers were real (for example, because of weather fluctuations, pest infestation and so on) and which were erroneous.
From Ray et al. 2013
Data
We used annual crop census reports for harvested areas and yield from ∼13,500 political units globally covering 20 years from 1989 to 2008 in this analysis though the database itself covers the years 1961 to 2008. The sum total of these census reports for the 20 years was approximately 1.8 million. Data were collected at three political levels/units depending on data availability: country, state/provinces, and county/district/município/department. Data were not available for all political units for each year. Details of the number of years data was available and its source is given in the Table S1. For the political units where data was missing for some years we estimated crop harvested and yield information using the average of the latest five years of reported data and constraining them with the reported numbers from the higher political unit as explained further in Text S1 and previous work.
Population data and its projections per country were from the United Nation’s medium variant projections. Crop production was determined using the projected crop yields at current observed rates of yield change and harvested areas fixed at ∼2007. Per capita harvested production is the ratio of production to population and a greater than ±10% change from ∼2007 is considered as significant either in the short- (2025) or long-term (2050).
Analysis
We linearly regressed 20 years of crop yields at each of the political units to determine the average linear rates of yield improvement over the observed period. Many previous studies have shown that crop yields change linearly and have used linear regression to project future crop yields. Here we calculate the non-compounding linear percentage rate by solving a in Equation 1; Y is the yield in the year 2008, 2Y is the yield in 2050 (after 42 years):
2Y = a*Y*42/ 100 + Y
This gives a rate of 2.38% per year or approximately 2.4% per year. For reported numbers at the local- to country- to global-scale the linear percentage changes are the observed changes using 2008 yields as the base year. The actual changes are provided in Data S1 for each crop and country.
Details of the method used, sensitivity to the number of years analyzed, as well as alternate regression methods are provided in Figures S6 and S9. The advantage of analyzing at high spatial resolution is that yield rates can be summarized for other unique levels. For example, we summarized the results for the Brazilian Legal Amazon (Figure S12 and Table S2). We compared our global numbers with other reported estimates. These comparisons are provided in Table S3.